In a press release last week National Grid announced that:
The company today launches innovative new software that forecasts the carbon intensity of electricity generation up to two days ahead, helping people to understand and control their energy use.
National Grid is working with Environmental Defense Fund Europe and WWF to make the software openly available to the public. WWF has used the data as the basis of an online tool which points users to the best times to turn on or turn off home appliances to minimise carbon emissions, while Environmental Defense Fund Europe are working on policy implications of having this data available and widely understood. Shifting activities like dishwasher cycles or electric vehicle charges could help relieve pressure on the energy system, reduce the need to use back-up fossil fuel plants, and potentially reduce bills for households.
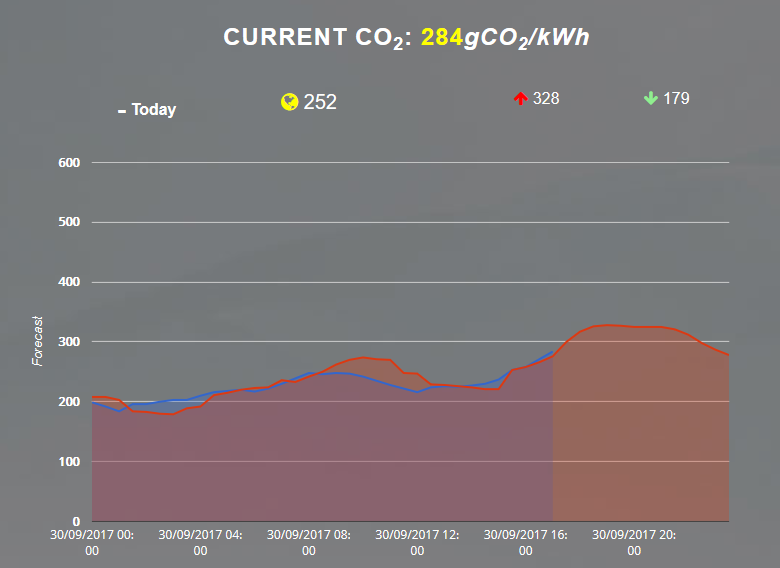
Here’s how National Grid’s visualisation of their carbon intensity data looks at the moment:
According to Duncan Burt, Director of the System Operator at National Grid:
We’re providing our forecast data in a format that allows technology companies to build innovative apps and software that could make a real difference to how and when people use energy. Clear and concise information that can tell you in advance when’s best to turn on the washing machine, load the dishwasher or charge your car for example, is a step in the right direction towards a low carbon future. This technology puts people at the heart of it, helping everyone to use power when it’s greenest, and likely, more cost efficient.
Simultaneously the WWF published a web page entitled “How do you make a green cup of tea” that presents the carbon intensity data in a “user friendly” fashion. According to the WWF:
Electricity is changing in the 21st century. Coal is being phased out and renewable energy sources like wind and solar now make up a quarter of our electricity.
This means that the greenness of our electricity now varies throughout the day. When it’s sunny and windy, we’ve got more green power. When it’s overcast and calm, we’ve got more fossil fuels online.
This new forecasting tool shows you what the greenest and dirtiest times of day will be up to two days ahead. This can help people plan their energy use, switching things on when energy is green and off when it’s not.
Being flexible with our energy use boosts our energy security and cuts carbon emissions by reducing the need for back-up fossil fuel generation. It could potentially save people money as well if they’re on time of use tariffs.
So if you want to make a green cup of tea, check out our forecast to find the greenest time of day to stick the kettle on.
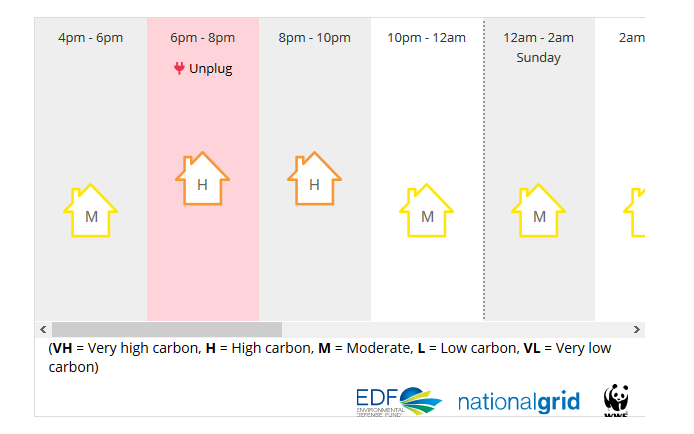
Here’s how that forecast looks at the moment:
Apart from the assorted press releases about the carbon intensity API there’s also a blog post from National Grid:
Working with WWF and Environmental Defense Fund Europe to finesse the science, we agreed to make the data that sits behind the forecast publicly available. The aim is to see tech developers creating consumer-friendly apps that can tell the public, in advance, when electricity generation is expected to be cleaner and greener, and more likely cost efficient.
The new software was a good idea hatched at a GB System Operator Hackathon and is yet another example of how our System Operator continues to be at the forefront of the energy revolution.
This new tool is a credit to the team in Wokingham – led by James Kelloway and his team members Alasdair Bruce and Lyndon Ruff, along with the sponsorship and guidance of Director of System Operations Duncan Burt and support from Corporate Affairs.
Not to be outdone the Met Office has also written another blog post on the topic:
Using hourly weather data from the Met Office and combining it with historical data from the grid, National Grid are able to forecast demand for electricity and also identify the contribution from renewable energy flowing into the grid. Using this information, they can forecast the carbon output of the grid over a 48-hour period, and identify the periods of lowest carbon output and highest carbon output. In other words, how green the grid will be during that period.
Using this information, the partners involved in the project hope that electricity consumers across Great Britain will be able to plan their electricity use around periods of high availability for renewable energy, reducing carbon output.
Patrick Sachon, Met Office Business Group Leader for Energy said: “The green energy forecast is a great example of innovative re-use of Met Office data. As a scientific organisation we encourage the re-use of our data, particularly if it can be applied to develop a deeper understanding of the interrelation between weather and something that is so integral to our everyday lives such energy.”
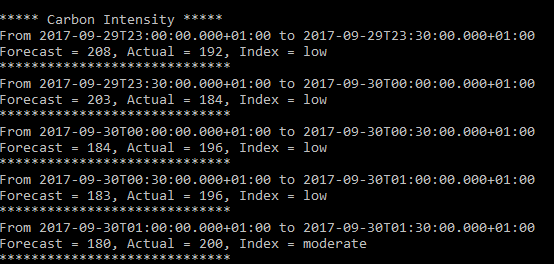
Down here at V2G UK we like to think of ourselves as an “innovative technology company” so we’ve already started using the new API. It’s very easy to use if you’ve ever written a JSON parser before, which fortunately we have. Here’s how the raw data for today looks as decoded by our trusty Raspberry Pi:
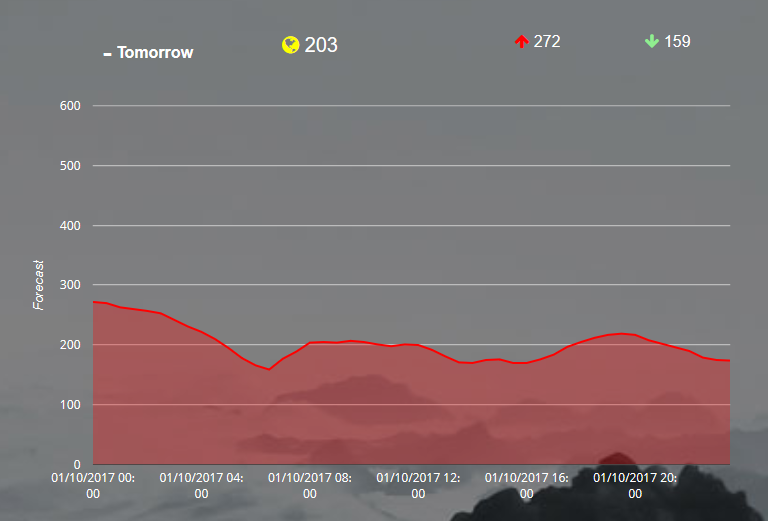
We haven’t persuaded our Pi to produce any pretty pictures as yet, so for now here’s National Grid’s forecast for tomorrow, which is forecast by the Met Office to be rather wet and windy:
Having slaved over a hot keyboard typing in this article I could really do with a nice hot cup of tea now, but it looks as though now is not a very good time. Wouldn’t it be a good idea if I could boil a kettle using electrical energy obtained from my very own battery instead of from the local grid? Another good idea would be if, much like the Met Office already do for the weather, National Grid could supply us with a carbon intensity forecast for Camelford as well as for the UK as a whole.
Our experimental application is now producing simple graphs. If you’d like to experiment along similar lines we’ve uploaded our Java source code to GitHub. For further details see our new project page:


Here’s the output from our Carbon Intensity demo application this morning:
According to the National Grid Control Room Twitter feed:
Overnight carbon intensity didn’t fall as far as forecast:
No new record today!
Definitely no longer in record territory today:
The wind has dropped since a few days ago:
Here’s the current UK electricity generation mix, courtesy of GridWatch: